Each workload exists because a real inference engine does it. Each page below
documents what the engine does, why generic tools can't see it, exactly what CAI measures,
and how it is scored — fully reproducible from the methodology.
Storage
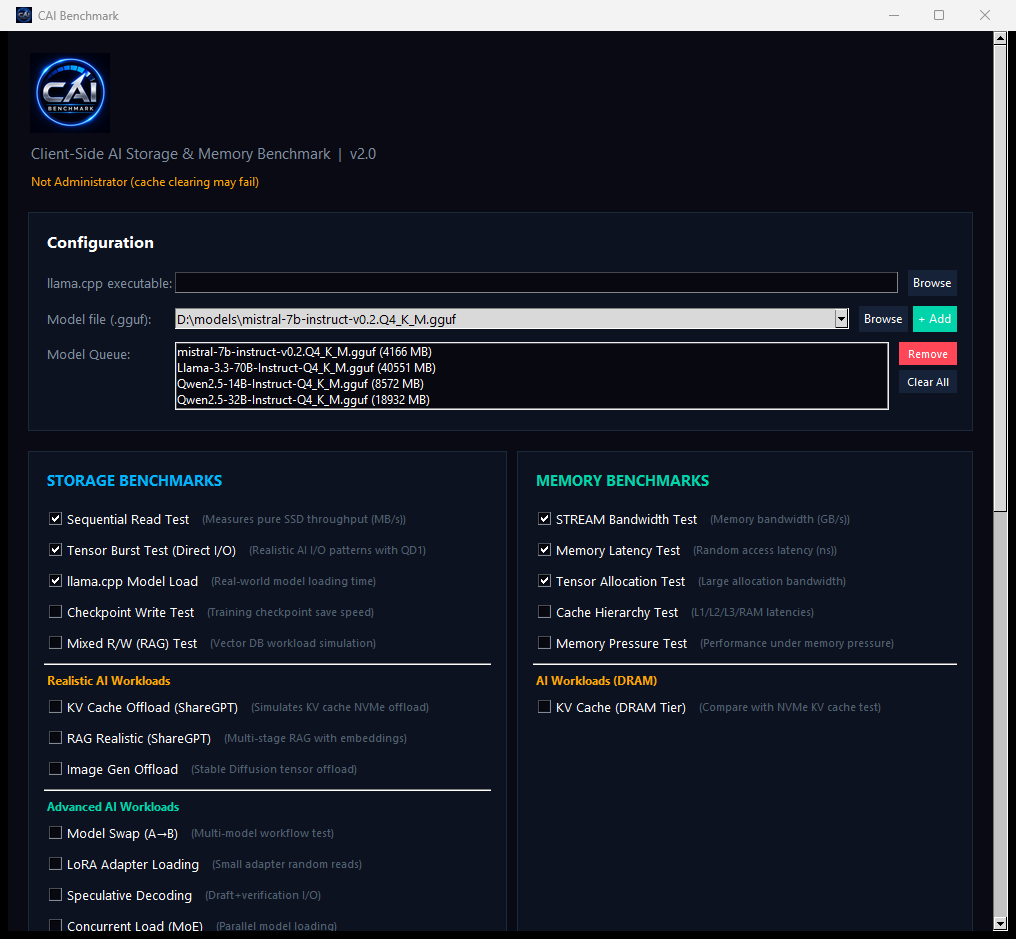
Model Load (TTFT)
Time-to-first-token starts with reading 4–40 GB of weights from disk. CAI measures real llama.cpp load time with cache-contamination detection.
Read the science →
Storage
KV-Cache Offload
Long-context chats overflow VRAM and spill the KV cache to NVMe. CAI replays a ShareGPT conversation trace against your drive.
Read the science →
Storage
Tensor Burst I/O
QD1 burst reads with think-time cycles — the access pattern of layer-by-layer tensor streaming, invisible to QD32 benchmarks.
Storage
RAG Mixed Read/Write
Vector-database lookups interleaved with writes — the I/O signature of retrieval-augmented generation.
Storage
Checkpoint Write
Training and fine-tuning checkpoint saves: large sequential writes under time pressure.
Storage
Model Swap & LoRA Load
Unload model A, load model B; hot-swap LoRA adapters. The workload of every multi-model workflow.
Memory
STREAM Bandwidth
The canonical Copy/Scale/Add/Triad kernels — the ceiling on token generation speed for CPU inference.
Memory
Cache Hierarchy & Latency
L1/L2/L3/DRAM latency profiling and random-access latency under AI-realistic working sets.
Memory
DRAM-Tier KV Cache
The same KV-cache workload run in memory — quantifying exactly what NVMe offload costs you.